Following up on the Near Term Technical Roadmap for OpenSpending (and here), I’ve been working on modifying some of the OpenSpending visualization code (found here) to allow it to visualize flat files (CSV) of aggregated financial data. As an example, check out:
This page pulls down a CSV file of aggregated data from HM Treasury Country and Regional Analysis (hosted on GitHub here and aggregation script here). The modified visualization code then transforms that CSV into a simple tree consumable by the treemap renderer. For comparison, the original visualization can be found on OpenSpending (note, the numbers are different because the experimental version is an aggregate of all data 2004-2010 and not split by year).
As it is, the added code is rather simple and currently needs some arguments passed to it to work. For example, if you check out the HTML source, you can see that the currency needs to be specified as well as a pointer to the column name containing the amounts to be summed.
This is a work-in-progress and some key questions are apparent:
Comparing the OpenSpending version to my version, you can see the government function “Helping Others” is replaced with the much less useful COFOG code “10” . When should a join be performed with some other table to get meaningful labels and descriptions? (front-end at visualization time or “backend” at CSV generation time?). How and where to specify that join operation?
Where and when should the currency be specified? On the level of the entire dataset?
The intention here is to gain some understanding of the key requirements for the OpenSpending Data Package by working with “real data and real needs”. Please let me know what you think.
@rufuspollock in order to generate a treemap from a basic CSV, you should include the following JS in your HTML document. Note: The variable amount_col_name defaults to “amount” if left out.
var data = {
  currency: "GBP",
  aggregated_csv_url: "../aggregates/by-cofog1-then-department.csv",
  amount_col_name: "value"
};

var options = {
  data: data
};

$('#treemap').treemap(options);
Where “by-cofog1-then-department.csv” (i.e. raw spending data aggregated by COFOG Level 1, then department code) looks something like this:
Seems obvious, but it occurs to me that adding labels directly to the aggregated CSV will result in a much larger CSV download. And CSVs don’t seem to benefit from server-side gzip compression. One of the example aggregations we’re working with is 1MB
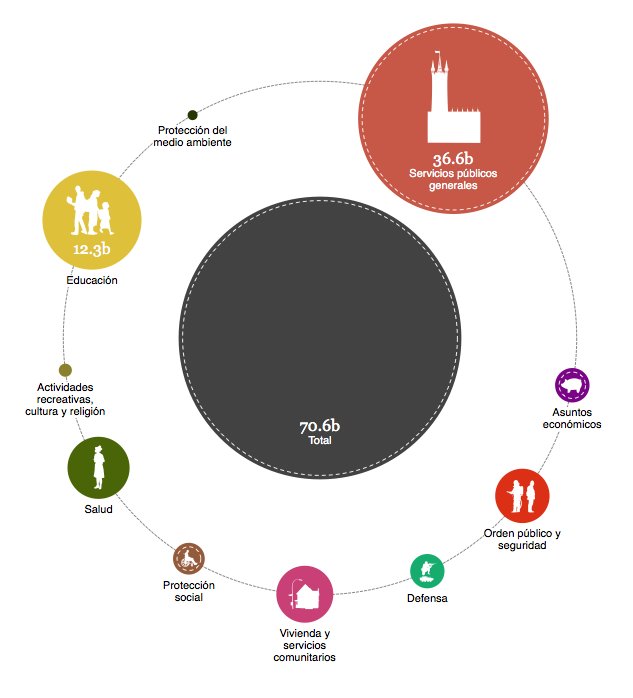
In an attempt to address a use case posted via GitHub, I thought one way toward this would be pass a labels key in the visualization initialization code. Example:
 var data = {
    currency: "GBP",
    aggregated_csv_url: "csv/by-cofog1-then-cofog2.csv",
    amount_col_name: "amount",
    labels: {
      "root": "Total",
      "01":    "Servicios públicos generales",
      "02":    "Defensa",
      "03":    "Orden público y seguridad",
      ...
Cool, thanks! We’ll default to using the labels straight from the CSV, but the specific case here is when the data is, for instance, normalized across several files and we only have (e.g. COFOG) codes as above.
 . When should a join be performed with some other table to get meaningful labels and descriptions? (front-end at visualization time or “backend” at CSV generation time?). How and where to specify that join operation?